Originally posted on tech.shift.com
We recently completed a very successful round of Cassandra tuning here at SHIFT. This post will cover one of the most impactful adjustments we made, which was to the JVM garbage collection settings. I'll be discussing how the JVM garbage collector works, how it was affecting our cluster performance, the adjustments we made, their effects, the reasoning behind them, and share the tools and techniques we used.
The cluster we tuned is hosted on AWS and is comprised of 6 hi1.4xlarge EC2 instances, with 2 1TB SSDs raided together in a raid 0 configuration. The cluster's dataset is growing steadily. At the time of this writing, our dataset is 341GB, up from less than 200GB a few months ago, and is growing by 2-3GB per day. The workload on this cluster is very read heavy, with quorum reads making up 99% of all operations.
How the JVM's garbage collection works, and how it affects Cassandra's performance
When tuning your garbage collection configuration, the main things you need to worry about are pause time and throughput. Pause time is the length of time the collector stops the application while it frees up memory. Throughput is determined by how often the garbage collection runs, and pauses the application. The more often the collector runs, the lower the throughput. When tuning for an OLTP database like Cassandra, the goal is to maximize the number of requests that can be serviced, and minimize the time it takes to serve them. To do that, you need to minimize the length of the collection pauses, as well as the frequency of collection.
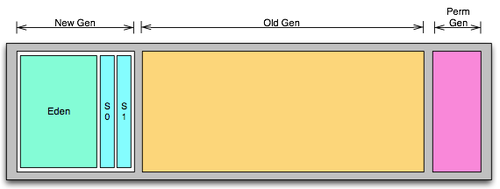
With the garbage collector Cassandra ships with, the jvm's available memory is divided into 3 sections. The new generation, the old generation, and the permanent generation. I'm going to be talking mainly about the new and old generation. For your googling convenience, the new gen is collected by the Parallel New (ParNew) collector, and the old gen is collected by the Concurrent Mark and Sweep (CMS) collector.
The New Generation
The new generation is divided into 2 sections: eden, which takes up the bulk of the new generation, and 2 survivor spaces. Eden is where new objects are allocated, and objects that survive collection of eden are moved into the survivor spaces. There are 2 survivor spaces, but only one is occupied with objects at a time, the other is empty.
When eden fills up with new objects, a minor gc is triggered. A minor gc stops execution, iterates over the objects in eden, copies any objects that are not (yet) garbage to the active survivor space, and clears eden. If the minor gc has filled up the active survivor space, it performs the same process on the survivor space. Objects that are still active are moved to the other survivor space, and the old survivor space is cleared. If an object has survived a certain number of survivor space collections, (cassandra defaults to 1), it is promoted to the old generation. Once this is done, the application resumes execution.
The two most important things to keep in mind when we're talking about ParNew collection of the new gen are:
1) It's a stop the world algorithm, which means that everytime it's run, the application is paused, the collector runs, then the application resumes.
2) Finding and removing garbage is fast, moving active objects from eden to the survivor spaces, or from the survivor spaces to the old gen, is slow. If you have long ParNew pauses, it means that a lot of the objects in eden are not (yet) garbage, and they're being copied around to the survivor space, or into the old gen.
The Old Generation
The old generation contains objects that have survived long enough to not be collected by a minor GC. When a pre-determined percentage of the old generation is full (75% by default in cassandra), the CMS collector is run. Under most circumstances, it runs while the application is running, although there are 2 stop the world pauses when it identifies garbage, but they are typically very short, and don't take more than 10ms (in my experience). However, if the old gen fills up before the CMS collector can finish, it's a different story. The application is paused while a full gc is run. A full GC checks everything: new gen, old gen, and perm gen, and can result in significant (multi-second) pauses. If you're seeing multi-second GC pauses, you're likely seeing major collections happening. If you're seeing these, you need to fix your gc settings.
Our performance problems
As our dataset grew, performance slowly started to degrade. Eventually, we reached a point where nodes would become unresponsive for several seconds or more. This would then cause the clusters to start thrashing load around, bringing down 3 or more nodes for several minutes.
As we looked into the data on opscenter, we started to notice a pattern. Reads per second would increase, then the par new collection time and frequency would increase, then the read latency times would shoot up to several seconds, and the cluster would become unresponsive.
So we began tailing the gc logs, and noticed there were regular pauses of over 200ms (ParNew collections), with some that were over 15 seconds (These were Full GCs). We began monitoring Cassandra on one or two nodes with jstat during these periods of high latency.
jstat is a utility that ships with the jvm, it shows what is going on in your different heap sections, and what the garbage collector
is doing. The command jstat -gc <pid> 250ms 0 will print the status of all generations every quarter second. Watching the eden figures,
we could see that eden was filling up several times per second, triggering very frequent minor collections. Additionally, the minor
collection times were regularly between 100 and 300 milliseconds, and up to 400 milliseconds in some cases. We were also seeing major
collections happening every few minutes that would take 5-15 seconds. Basically, the garbage collector was so far out of tune with
Cassandra's behavior that Cassandra was spending a ton of time collecting garbage. Cutting the number of requests isn't a real solution,
and iostat made it pretty clear that the disk was not the bottleneck (read throughput was around 2MB/sec), so adding new nodes would be
an expensive waste of hardware (we'd also tried adding new nodes, and it hadn't helped).
Given this information, we came up with the following hypothesis: Each read request is allocating short lived objects for both the result being returned to the client/coordinator, as well as objects that actually process the request (iterators, request/response objects, etc, etc). With the rate that the requests are coming in, and the frequency of new gen collections, it seemed pretty likely that a lot of the objects in eden at the start of a gc would be involved in the processing of requests, and would therefore, be garbage very soon. However, given the rate of requests and ParNew collections, they weren't yet garbage when inspected by the par new collector. Since 99% of the requests are reads, requests don't have any long term side effects, like mutating memtables, so there's no reason why they need to be promoted out of eden.
If this hypothesis was true, it had 2 implications:
First, the par new collection is going to take a long time because it's copying so many objects around (remember, collecting garbage is fast, copying objects between eden/survivor spaces and generations is slow). The 200ms ParNew collection times indicated this was happening.
Second, all of these transient request related objects are getting pushed into the new gen, which is quickly getting filled up with objects that will soon be garbage. If these transient objects are moved into the old gen faster that the CMS collector can keep up, a major gc will be triggered, stopping cassandra for several seconds.
If this was the case, it seemed likely that increasing the size of eden would solve our problems. By reducing the rate that eden reaches capacity, more of eden's contents will be garbage. This will make the par new collection faster, and reduce the rate that transient objects are pushed into the old gen. More importantly, objects would be promoted at a rate that the CMS collector can handle, eliminating major, multi second, stop the world collections.
I didn't take any screen shots of jstat when the garbage collector was misbehaving, but this is an approximation of what we were seeing.
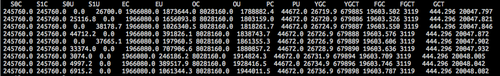
In this image, we can see that there are a lot of new gen collections (see the YGCT column). And we can see the survivor section usage switching back and forth very often, indicating a lot of young gen collections. Additionally, the old gen is continuously increasing as objects are prematurely promoted.
New GC settings
The initial heap settings were a total heap size of 8GB, and a new gen size of 800MB. Initially, we tried doubling the new gen size to 1600MB, and the results were promising. We were not having any more runaway latency spikes, but we were still seeing read latencies as high as 50ms under heavy load, which, while not catastrophic, made our application noticably sluggish. The new gen collection times were still higher than 50ms.
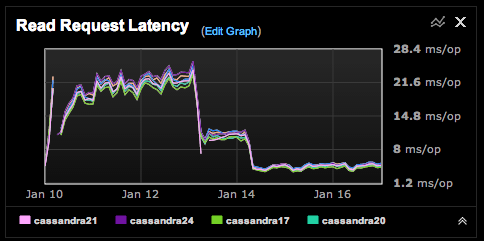
After a few days of experimenting with various gc settings, the final settings we converged on was 10GB total for the heap, and 2400MB for the new gen. We had increased the total heap by 25%, and tripled the size of the new gen. The results have been excellent. With these settings, I haven't seen the read latencies go above 10ms, and I've seen the cluster handle 40 thousand plus reads per second with latencies around 7ms. New gen collection times are now around 15ms, and they happen slightly less than once per second. This means that Cassandra went from spending around 20% or more of it's time collecting garbage, to a little over 1%.
This is a look at the garbage collection activity on one of our tuned up nodes today.
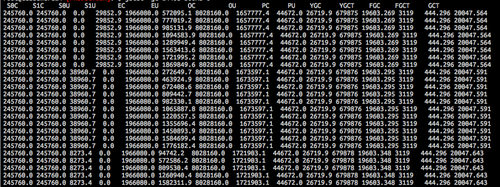
You can see the eden consumption creep up over 2 seconds (see the EU column), then a minor GC is performed. Additionally, the old gen size is pretty stable.
Tools we used to diagnose the problems.
1) Opscenter: Datastax's opscenter tool was very helpful and provided a highlevel view of our cluster's health and performance
2) GC Logging: They're not enabled by default, but the garbage collection logs give a lot of insight into the what the garbage collector is doing, and how often it's doing it. To enable the gc logs, uncomment the GC logging options in cassandra-env.sh
3) iostat: reports disk usage. Running iostat -dmx 1 will print out your disk usage stats every second. You can use this to
quickly determine if disk is your bottleneck.
4) jstat: as mentioned earlier, jstat provides a real time look at what gc is doing, and is very helpful. With jstat, you can watch the usage of eden,
the survivor spaces, and the old gen, gc counts and times, and watch as the jvm shifts things arounds the different sections.
Using the command jstat -gc <pid> 250ms 0 will print the status of all generations every quarter second.
For experimentation, we used a single node in our production cluster as our test bed. We would make incremental changes to the node's settings and watch how it performed relative to the other nodes.